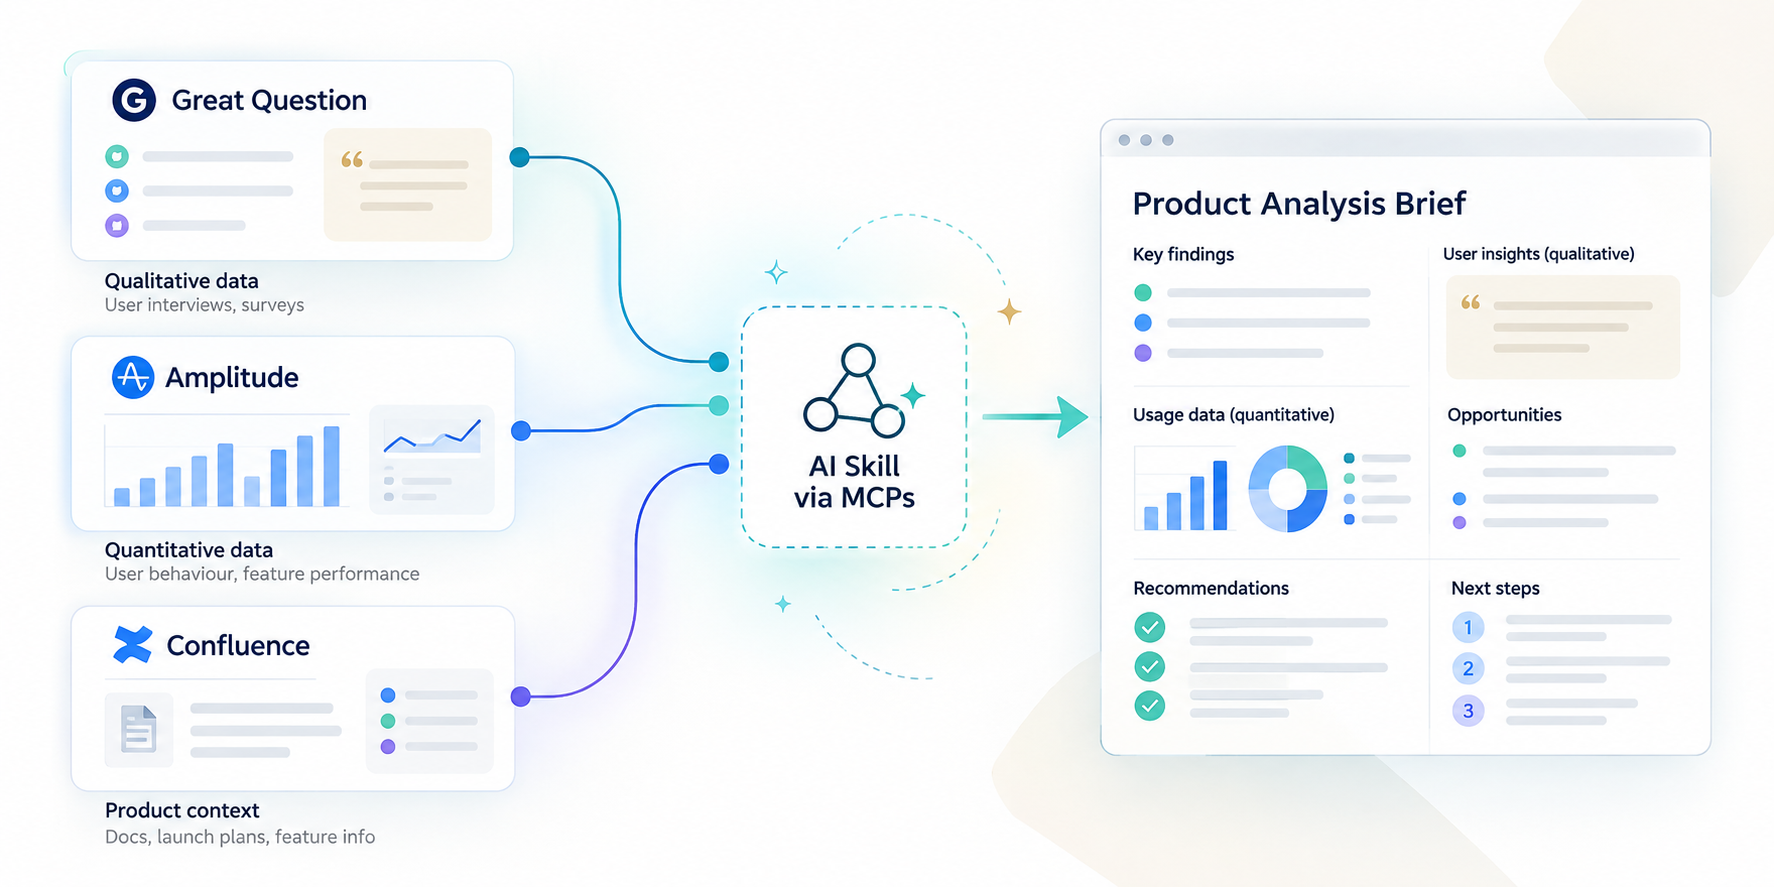
As a Product Manager in an organization that is hyper-focused on launching new features, it can be difficult to also track their impact post-release. Iterating on features and knowing when to kill ones that aren’t meeting user needs is time-consuming but valuable analysis that is necessary for managing a product’s lifecycle.
Qualitative data, including user interviews, surveys, usability testing, etc. are troves of information that provide both critical understanding of your feature’s performance and help answer the “why” questions around user intent. The quantitative data - how users click and interact with your digital features - help you identify opportunities for improvement, potential tracking bugs, etc.
But these data sets tend to live in separate tools.
In my case, we use Amplitude for quantitative event tracking, and Great Question for conducting and storing qualitative data.
Before MCPs, I would manually review Amplitude dashboards and cross-reference them with qualitative responses from surveys to get the full picture of how my features were performing. This required periodically checking for new survey responses, and also monitoring event behaviour.
If I had to estimate, this would take several hours over the course of a month, and each time I had to reprocess the information because new data had been logged in the intervening period. This was time-consuming and was often skipped during busy periods before a launch.
To run a product analysis from VS Code using Copilot on my existing Amplitude dashboards and survey responses in Great Question.
As a proof of concept, I wrote a reusable skill that could be applied to any feature so long as you had both the survey name and dashboard name.
Steps for connecting to MCPs via VS Code:
See VS Code's guide to adding MCP servers.
Before running a skill or agent to perform data synthesis and analysis, make sure the underlying data you’re providing to an LLM has been validated and verified. Pointing the MCP towards an Amplitude dashboard with unverified data is going to yield poor and likely inaccurate results that will compromise the quality of your analysis. If you modify the filters on the charts in the dashboard at a later date and then rerun the skill, it could skew the analysis.
You also should have a solid understanding of the data’s limitations before attempting to use an LLM so that you can verify the synthesis output.
I wrote the skill prompt in such a way that it could be reused for other features and by other PMs — making it easier to scale.
name: ux-research-analytics-review
description: 'Act as a Product Manager to analyze qualitative survey findings against Amplitude analytics data and Confluence context docs, then publish a one-page UX findings report as a new Confluence page. Use when asked to review survey feedback alongside an Amplitude chart, cross-reference Confluence documentation, identify UX opportunities, or publish research findings to Confluence.'
argument-hint: '[survey/study name or link] [Amplitude chart URL] [Confluence doc URL(s)] [Confluence space name]'
# Advisory only — SKILL.md does not currently enforce tool scoping; use a paired .agent.md for actual restriction.
tools:
  - mcp_amplitude_mcp_get_from_url
  - mcp_atlassian-mcp_fetch
  - mcp_atlassian-mcp_getConfluencePage
  - mcp_atlassian-mcp_getConfluenceSpaces
  - mcp_atlassian-mcp_createConfluencePage
  - mcp_great_questio_search_studies
  - mcp_great_questio_get_study
  - mcp_great_questio_search_survey_studies
  - mcp_great_questio_get_survey_study
  - mcp_great_questio_search_survey_responses
---

# UX Research & Analytics Review

Combines qualitative survey feedback with quantitative Amplitude data and existing
Confluence context to produce a one-page UX findings report, published as a new
Confluence page.

## When to Use

- User wants a Product Manager-style analysis comparing survey feedback to an
  Amplitude chart/dashboard.
- User wants findings cross-referenced against existing Confluence documentation.
- User wants a one-page UX findings report created as a new Confluence page.

## Required Inputs

If any of these are missing, ask the user before proceeding:

1. **Survey/study name or link** — the Great Question survey or study to
   analyze, given as a link or as a name/title to search for. A pasted
   summary or document is also acceptable if the data isn't in Great
   Question.
2. **Amplitude chart URL** — the quantitative data to compare against.
3. **Confluence doc URL(s)** — background/context documents.
4. **Confluence space name** — where the new findings page should be created.

## Procedure

1. **Fetch the Amplitude data.** Use the Amplitude MCP tools (e.g.
   `mcp_amplitude_mcp_get_from_url`) to pull the chart definition and
   underlying data from the provided URL. Prefer MCP tools over manually
   parsing dashboard screenshots.
2. **Fetch Confluence context.** Use the Atlassian MCP tools (e.g.
   `mcp_atlassian-mcp_fetch` or `mcp_atlassian-mcp_getConfluencePage`) to read
   each provided Confluence document. Prefer MCP over direct REST calls.
3. **Gather the qualitative research findings via Great Question MCP.**
   - If the user gave a **link**, extract the study/survey ID from it and
     fetch it directly with `mcp_great_questio_get_survey_study` (survey) or
     `mcp_great_questio_get_study` (other study types).
   - If the user gave a **name/title** instead, search for it first with
     `mcp_great_questio_search_survey_studies` or
     `mcp_great_questio_search_studies` (using `q` to match the title), then
     fetch the matched result by ID.
   - Once the study/survey is identified, fetch the underlying responses
     with `mcp_great_questio_search_survey_responses` to get the actual
     qualitative answers, not just metadata.
   - If the data isn't in Great Question (e.g. a file, spreadsheet, or
     Confluence/Jira source), fetch it the same way as step 2. If the user
     hasn't provided a link, name, or the raw findings, ask before proceeding.
4. **Analyze.** Compare qualitative themes from the survey against the
   Amplitude data trends. Identify:
   - What's working (supported by both qualitative and quantitative signals).
   - What's worth exploring further from a UX perspective.
   - Don't limit yourself strictly to the explicit inputs — call out any other
     relevant UX opportunities or risks the source material surfaces.
5. **Draft a one-page report.** Keep it concise. Structure with:
   - Summary of findings
   - What's working
   - What's worth exploring
   - Source material references (links to the survey, Amplitude chart, and
     each Confluence doc used)
6. **Resolve the target space.** Use
   `mcp_atlassian-mcp_getConfluenceSpaces` to confirm the space key for the
   space name provided.
7. **Publish.** Create the new Confluence page under that space using
   `mcp_atlassian-mcp_createConfluencePage`, with the one-page report as the
   content.
8. **Confirm.** Share the new Confluence page link with the user.
When you call the skill, it will ask you for four things:
Once you've provided these, the skill takes it from there.
It pulls the data, compares what users said with how they actually behaved, and publishes a one-page brief to Confluence, then shares the link with you.
(Tailor this depending on your needs)
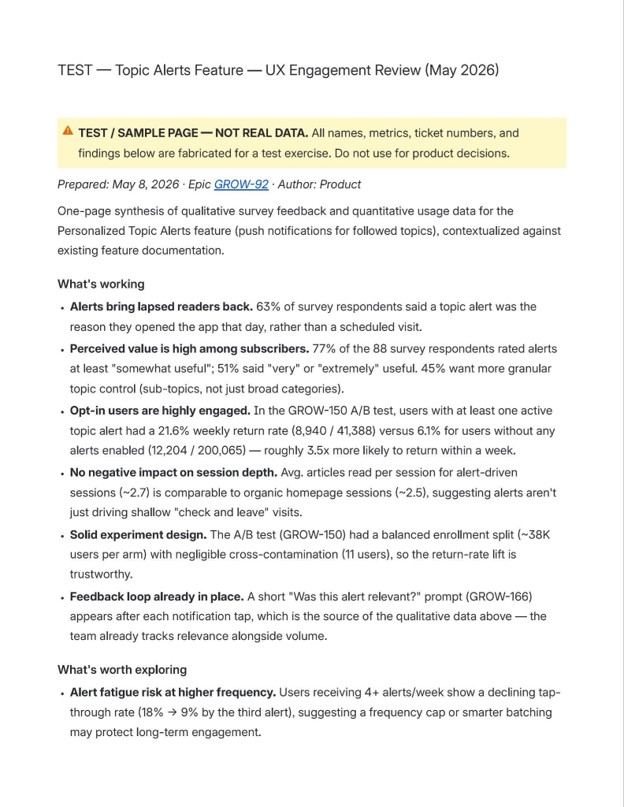
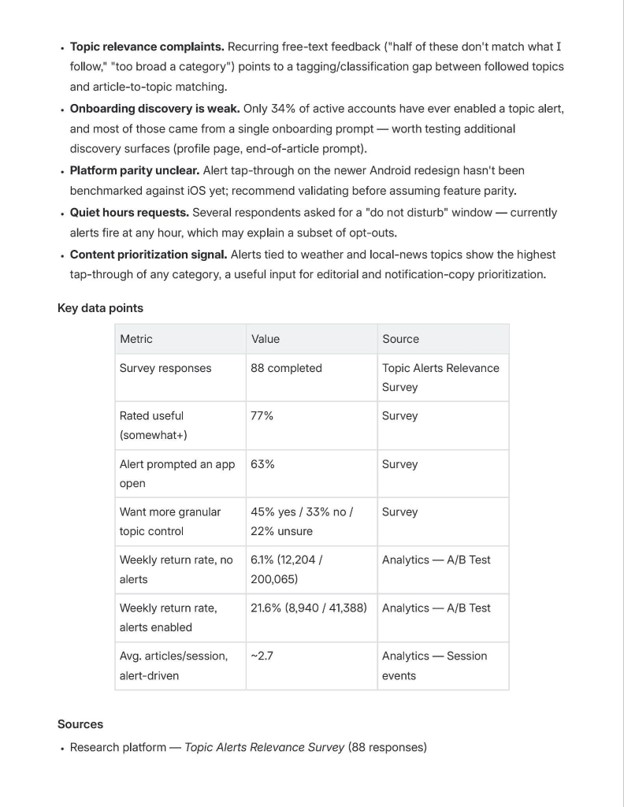
I had mine automatically create a one-page, high-level product analysis brief that I could share with executive stakeholders.
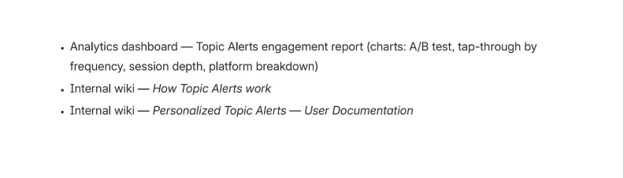
This brief has a specific format for consistency. At the bottom of the brief are links back to the original source materials in Amplitude and Great Question.
The Good
At first, I was impressed by the MCPs’ ability to retrieve the information I needed and run the analysis. When using Copilot in VS Code, I could see it searching across Jira, Confluence, Great Question, and Amplitude to understand what the feature was about, how it was performing, and how users felt about it.
That visibility helped me see the value of bringing multiple data sources together in one workflow. Instead of manually pulling information from each tool and cross-referencing it myself, I could use the skill to synthesize the inputs into a single product analysis.
The Not As Good
Without a strict skill guiding it, Copilot searches far more than it needs to, which bloats the context and drives up token usage. The more precisely the skill defined where to look and what to produce, the more focused and cost-effective the analysis became.
1. Start with trusted data. Validate the dashboards and research inputs before asking an LLM to synthesize them.
2. Make the workflow reusable. Define the inputs, sources, analysis steps, and output format once so you can apply the same skill to other features.
3. Adapt it to your stack. I use Great Question, Amplitude, and Confluence, but the same pattern can work with the research, analytics, and documentation tools your team already uses.
Mentorship program and in-person event experiences are at an extra cost.
Join for free!Join the TPMA Slack Community with 1000+ members
Free Virtual TPMA events for the entire TPMA Season
Become the first to know about in-person events and networking opportunities
As a Product Manager in an organization that is hyper-focused on launching new features, it can be difficult to also track their impact post-release. Iterating on features and knowing when to kill ones that aren’t meeting user needs is time-consuming but valuable analysis that is necessary for managing a product’s lifecycle.
Qualitative data, including user interviews, surveys, usability testing, etc. are troves of information that provide both critical understanding of your feature’s performance and help answer the “why” questions around user intent. The quantitative data - how users click and interact with your digital features - help you identify opportunities for improvement, potential tracking bugs, etc.
But these data sets tend to live in separate tools.
In my case, we use Amplitude for quantitative event tracking, and Great Question for conducting and storing qualitative data.
Before MCPs, I would manually review Amplitude dashboards and cross-reference them with qualitative responses from surveys to get the full picture of how my features were performing. This required periodically checking for new survey responses, and also monitoring event behaviour.
If I had to estimate, this would take several hours over the course of a month, and each time I had to reprocess the information because new data had been logged in the intervening period. This was time-consuming and was often skipped during busy periods before a launch.
To run a product analysis from VS Code using Copilot on my existing Amplitude dashboards and survey responses in Great Question.
As a proof of concept, I wrote a reusable skill that could be applied to any feature so long as you had both the survey name and dashboard name.
Steps for connecting to MCPs via VS Code:
See VS Code's guide to adding MCP servers.
Before running a skill or agent to perform data synthesis and analysis, make sure the underlying data you’re providing to an LLM has been validated and verified. Pointing the MCP towards an Amplitude dashboard with unverified data is going to yield poor and likely inaccurate results that will compromise the quality of your analysis. If you modify the filters on the charts in the dashboard at a later date and then rerun the skill, it could skew the analysis.
You also should have a solid understanding of the data’s limitations before attempting to use an LLM so that you can verify the synthesis output.
I wrote the skill prompt in such a way that it could be reused for other features and by other PMs — making it easier to scale.
name: ux-research-analytics-review
description: 'Act as a Product Manager to analyze qualitative survey findings against Amplitude analytics data and Confluence context docs, then publish a one-page UX findings report as a new Confluence page. Use when asked to review survey feedback alongside an Amplitude chart, cross-reference Confluence documentation, identify UX opportunities, or publish research findings to Confluence.'
argument-hint: '[survey/study name or link] [Amplitude chart URL] [Confluence doc URL(s)] [Confluence space name]'
# Advisory only — SKILL.md does not currently enforce tool scoping; use a paired .agent.md for actual restriction.
tools:
  - mcp_amplitude_mcp_get_from_url
  - mcp_atlassian-mcp_fetch
  - mcp_atlassian-mcp_getConfluencePage
  - mcp_atlassian-mcp_getConfluenceSpaces
  - mcp_atlassian-mcp_createConfluencePage
  - mcp_great_questio_search_studies
  - mcp_great_questio_get_study
  - mcp_great_questio_search_survey_studies
  - mcp_great_questio_get_survey_study
  - mcp_great_questio_search_survey_responses
---

# UX Research & Analytics Review

Combines qualitative survey feedback with quantitative Amplitude data and existing
Confluence context to produce a one-page UX findings report, published as a new
Confluence page.

## When to Use

- User wants a Product Manager-style analysis comparing survey feedback to an
  Amplitude chart/dashboard.
- User wants findings cross-referenced against existing Confluence documentation.
- User wants a one-page UX findings report created as a new Confluence page.

## Required Inputs

If any of these are missing, ask the user before proceeding:

1. **Survey/study name or link** — the Great Question survey or study to
   analyze, given as a link or as a name/title to search for. A pasted
   summary or document is also acceptable if the data isn't in Great
   Question.
2. **Amplitude chart URL** — the quantitative data to compare against.
3. **Confluence doc URL(s)** — background/context documents.
4. **Confluence space name** — where the new findings page should be created.

## Procedure

1. **Fetch the Amplitude data.** Use the Amplitude MCP tools (e.g.
   `mcp_amplitude_mcp_get_from_url`) to pull the chart definition and
   underlying data from the provided URL. Prefer MCP tools over manually
   parsing dashboard screenshots.
2. **Fetch Confluence context.** Use the Atlassian MCP tools (e.g.
   `mcp_atlassian-mcp_fetch` or `mcp_atlassian-mcp_getConfluencePage`) to read
   each provided Confluence document. Prefer MCP over direct REST calls.
3. **Gather the qualitative research findings via Great Question MCP.**
   - If the user gave a **link**, extract the study/survey ID from it and
     fetch it directly with `mcp_great_questio_get_survey_study` (survey) or
     `mcp_great_questio_get_study` (other study types).
   - If the user gave a **name/title** instead, search for it first with
     `mcp_great_questio_search_survey_studies` or
     `mcp_great_questio_search_studies` (using `q` to match the title), then
     fetch the matched result by ID.
   - Once the study/survey is identified, fetch the underlying responses
     with `mcp_great_questio_search_survey_responses` to get the actual
     qualitative answers, not just metadata.
   - If the data isn't in Great Question (e.g. a file, spreadsheet, or
     Confluence/Jira source), fetch it the same way as step 2. If the user
     hasn't provided a link, name, or the raw findings, ask before proceeding.
4. **Analyze.** Compare qualitative themes from the survey against the
   Amplitude data trends. Identify:
   - What's working (supported by both qualitative and quantitative signals).
   - What's worth exploring further from a UX perspective.
   - Don't limit yourself strictly to the explicit inputs — call out any other
     relevant UX opportunities or risks the source material surfaces.
5. **Draft a one-page report.** Keep it concise. Structure with:
   - Summary of findings
   - What's working
   - What's worth exploring
   - Source material references (links to the survey, Amplitude chart, and
     each Confluence doc used)
6. **Resolve the target space.** Use
   `mcp_atlassian-mcp_getConfluenceSpaces` to confirm the space key for the
   space name provided.
7. **Publish.** Create the new Confluence page under that space using
   `mcp_atlassian-mcp_createConfluencePage`, with the one-page report as the
   content.
8. **Confirm.** Share the new Confluence page link with the user.
When you call the skill, it will ask you for four things:
Once you've provided these, the skill takes it from there.
It pulls the data, compares what users said with how they actually behaved, and publishes a one-page brief to Confluence, then shares the link with you.
(Tailor this depending on your needs)
I had mine automatically create a one-page, high-level product analysis brief that I could share with executive stakeholders.
This brief has a specific format for consistency. At the bottom of the brief are links back to the original source materials in Amplitude and Great Question.
The Good
At first, I was impressed by the MCPs’ ability to retrieve the information I needed and run the analysis. When using Copilot in VS Code, I could see it searching across Jira, Confluence, Great Question, and Amplitude to understand what the feature was about, how it was performing, and how users felt about it.
That visibility helped me see the value of bringing multiple data sources together in one workflow. Instead of manually pulling information from each tool and cross-referencing it myself, I could use the skill to synthesize the inputs into a single product analysis.
The Not As Good
Without a strict skill guiding it, Copilot searches far more than it needs to, which bloats the context and drives up token usage. The more precisely the skill defined where to look and what to produce, the more focused and cost-effective the analysis became.
1. Start with trusted data. Validate the dashboards and research inputs before asking an LLM to synthesize them.
2. Make the workflow reusable. Define the inputs, sources, analysis steps, and output format once so you can apply the same skill to other features.
3. Adapt it to your stack. I use Great Question, Amplitude, and Confluence, but the same pattern can work with the research, analytics, and documentation tools your team already uses.
Toronto Product Management Association (TPMA) is a community focused on development, growth and networking of Product professionals in the Greater Toronto Area.